Data sources
What is AHN and when will your home be surveyed?
The Actueel Hoogtebestand Nederland (AHN) has laser-scanned new parts of the country from an aircraft every year since 1996. Since October 2025 the north-east sits in AHN6, accurate to five centimetres. Here is how to check when your address is due and which version currently covers it.
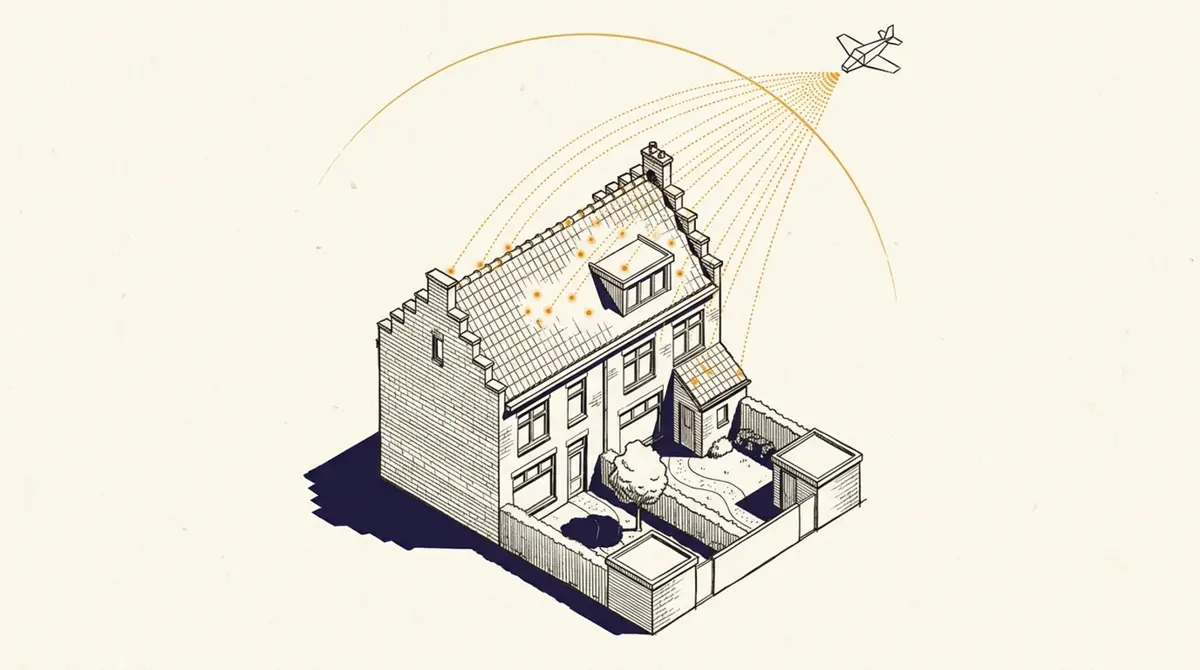
Every time you enter an address in Schaduwplan and a 3D scene of the neighbourhood appears on your screen, there is a survey underneath it that we did not carry out ourselves. The roofs, the trees, the ground level: that is all the work of an aircraft that flew over the Netherlands with a laser. That programme is called AHN, the Actueel Hoogtebestand Nederland (the national elevation model). How recent that survey is above your street largely determines how well we can model your situation.
This article explains what AHN is exactly, how it is collected, what has changed from version to version, and how to look up, for your own address, when it was last surveyed and when the next flight is due.
What is AHN?
The Actueel Hoogtebestand Nederland is a multi-year programme run by the water authorities, the provinces and Rijkswaterstaat with the aim of a digital elevation model of the whole of the Netherlands. The programme has run since 1996, is coordinated on behalf of the participants by Het Waterschapshuis, and delivers open data under the Creative Commons Attribution 4.0 licence. For every square metre of the Netherlands the height at ground level is known to within five centimetres.
The reason is practical: these three parties are jointly responsible for managing the water system and flood defences. You cannot size a dyke or run a drainage model without an accurate elevation picture. The government then released the elevation model as open data without conditions, to encourage reuse. That is precisely why applications such as 3DBAG, mapping services from the Kadaster, climate maps from the water authorities and sunlight tools like Schaduwplan can exist without anyone having to pay for the survey.
The model contains more than just the ground. AHN delivers three products side by side: a DTM (Digital Terrain Model, the bare ground only), a DSM (Digital Surface Model, with roofs, trees and structures included) and the raw point cloud in LAZ format. For sunlight analysis it is mainly the DSM that matters, because roofs, dormer windows, sheds and trees are what cast the shadow.
How is it collected?
An aircraft or helicopter flies a few hundred metres above the Netherlands and, from a laser scanner, sends thousands of pulses per second towards the ground. Each pulse that bounces back gives a three-dimensional point: x, y and z in NAP height. The combination of billions of those points is the point cloud. The DTM and DSM rasters are derived from it.
The quality specifications are strict. For AHN2, AHN3 and AHN4 the maximum systematic error is five centimetres and the maximum stochastic error (1σ) is five centimetres. In practice that means:
- at least 68.2% of the measured points fall within a 10 cm height deviation;
- at least 95.4% within 15 cm;
- at least 99.7% within 20 cm.
That is an order of magnitude better than AHN1, where the stochastic error was still 15 cm and the 95.4% threshold therefore sat at 35 cm.
The point density has also risen sharply over the years. In some places AHN1 had only 1 point per 16 m². AHN2 and AHN3 averaged 6 to 10 points per m². For AHN4 that is 10 to 14 points per m², and in dense urban areas (such as around Schiphol during the 2020 survey) even 20 to 24 points per m². The more points per m², the sharper a roof edge, a chimney or a dormer window comes through in the elevation model.
The rasters are delivered on a 0.5 m grid. For the whole of the Netherlands, the half-metre grid alone amounts to well over thirty-seven thousand map sheets per product and version. The raw point cloud comes in LAZ, a compressed LiDAR format. From AHN3 onwards that point cloud is classified: for each point the file records whether it is ground, water, a building, a civil structure or other.
Timeline from AHN1 to AHN6
Collection takes years, simply because an aircraft cannot scan the whole of the Netherlands in a week. Each version covers a different part of the country, so at any given moment you can easily have three or four different AHN versions in use side by side.
| Version | Survey period | Key characteristic |
|---|---|---|
| AHN1 | 1996–2002 | First nationwide survey, low point density |
| AHN2 | 2007–2012 | Higher point density, filtered point cloud |
| AHN3 | 2014–2019 | Classified point cloud (ground, water, buildings, civil structures) |
| AHN4 | 2020–2022 | 10–14 points per m²; nationwide in 3 years |
| AHN5 | survey ongoing 2026 | New DSM algorithm: highest point per cell |
| AHN6 | 1st part Oct 2025; rolling out 2026–2027 | High-voltage lines and pylons removed from DSM |
What stands out: from AHN3 onwards the cycle is no longer a fixed six years. AHN4 was designed to reach nationwide coverage faster than its predecessors. AHN5 and AHN6 then run partly in parallel and partly overlapping, to push currency up further.
AHN5 and AHN6: what is different?
Between AHN4 and AHN5 there is a methodological break. Up to and including AHN4 the half-metre rasters were derived as a weighted average (inverse distance weighting) of the underlying laser points in a cell. From AHN5 this changed: for the DTM it is now an unweighted average, and for the DSM it is the highest point per cell (except over water).
That sounds technical, but it matters for sunlight. If you average a point cloud on a roof edge or a ridge, you get a height that sits somewhere between the roof and the neighbouring points. On a steep roof shape that shaves just a little too much height off the ridge. By taking the highest point, ridges and dormer windows stay sharper in the DSM. For shadow calculation that is a gain, because it is precisely those higher parts that create the cast shadow.
With AHN6 there is a further change on top of that: from AHN6 onwards high-voltage lines and pylons are no longer included in the surface model. In AHN4 the lines had already been removed but the pylons had not; in AHN6 both are gone. For anyone living next to a high-voltage pylon who saw an inexplicably tall “shadow” appear in an earlier model: that problem is now solved.
With AHN6 the sheet layout has also become smaller. AHN2/3/4/5 were delivered in TOP10NL map sheets of 5×6.25 km. From AHN6 these are kilometre squares of 1×1 km, matching the sheet layout of Beeldmateriaal (the open aerial photography). At the same time Het Waterschapshuis re-derived the older versions (AHN2/3/4/5) on those small sheets, using the same calculation rules as AHN6. In practice that means: one sheet layout to think in, and a download of a small corner of the Netherlands is now much more manageable (megabytes instead of gigabytes).
When is my address next in line?
AHN collection is a rolling release. At the time you read this, the north-east of the Netherlands has already been surveyed for AHN6 (October 2025). For the rest of the country AHN5 and AHN6 flights are still running concurrently. The Where we are flying now page shows an interactive map of the active flight lines for the current year, hosted via Ellipsis Drive. Red lines have not yet been surveyed, green lines have.
How to check:
- Open where we are flying now and click through to the Ellipsis Drive map.
- Zoom in on your own region. Use the time bar at the top to see when a line was flown over your address.
- For a finer check: download the flight-lines GeoPackage for AHN6 or the strip envelopes from basisdata.nl. These contain a date field per strip.
There is deliberately no hard schedule for “when will AHN reach me”, because planning depends on weather, flight permits, coinciding aerial-photography flights and the participants’ priorities. The rule of thumb: somewhere in 2026 or 2027 something will fly over your street again, and with the combination of AHN5 and AHN6 the whole of the Netherlands will be re-surveyed in that period.
How do I check my address?
Two viewers from the AHN programme show at a glance what is known for your address.
viewer.ahn.nl is the standard raster viewer. You can switch between versions (AHN4, AHN5, AHN6) and between DTM and DSM. The value under the cursor is in metres NAP. By setting it to DSM and zooming in on your own roof you can see the height per half metre, and you can use the colour gradient to visually separate height differences between the roof, a roof addition and a chimney.
basisdata.nl/hwh-ahn/AHN_POTREE is the point-cloud viewer. There you see not the raster image but the individual laser measurements, optionally coloured with the aerial photo from Beeldmateriaal. For AHN6 (the north-east) that is strikingly beautiful: you get a coloured 3D cloud you can fly through. For checking a specific roof situation (which points sat on the ridge? was there already a chimney?) the point-cloud viewer beats the raster.
For heavier downloads (a whole kilometre block as GeoTIFF, or the raw LAZ) use Het Waterschapshuis’s self-service portal or the tile index as a map finder. For researchers and developers: GeoTiles from TU Delft delivers the same data in manageable tile packages.
What if my address has not yet been surveyed?
Three scenarios, three choices.
1. Waiting pays off, if you have time. For most places in the Netherlands, 2026 or 2027 will be the year of the next AHN survey. For a no-obligation neighbourhood study or a general sense of sunlight loss you can work perfectly well with AHN4 (2020–2022) and, once AHN5 or AHN6 is published in your region, run a fresh analysis.
2. BAG estimate with disclosure. When an address falls in a gap between AHN versions or an alteration was made after the last survey, you can fall back on an estimate via the BAG (number of storeys × ~3 m). That estimate has a ±30% margin, and serious tools like Schaduwplan show this explicitly so the reader (and the court) knows this is an estimate, not a measurement.
3. Commission your own survey. For a recent roof addition, a permit process or a procedure where every 10 cm counts, you can have a height survey done with drone photogrammetry, a handheld LiDAR or a professional land surveyor. You can upload that data to Schaduwplan as a GeoTIFF and so override the cascade for your building. How to go about it is set out in part 2 of this series: surveying height data yourself with drone, LiDAR and photogrammetry.
How does Schaduwplan use AHN?
Schaduwplan does not take its 3D buildings directly from the AHN point cloud. We work with a cascade in which AHN is the most important foundation, but only one of three layers.
- 3DBAG (primary) — per building a 3D mesh with a roof shape from a roof-fit on AHN. 62 attributes: ridge, eave and ground height, RMSE, AHN version, survey date.
- AHN WCS (fresh-data fallback) — if 3DBAG is older than the latest AHN flight in your map sheet, we lay the AHN raster over the BAG footprint ourselves.
- BAG estimate (last resort) — number of storeys × 3 m, with a loud disclaimer in the PDF and UI.
3DBAG is a product from TU Delft + 3DGI that builds a 3D mesh per BAG building by fitting a roof shape onto the AHN point cloud. It comes with a meta layer too: per building, 3DBAG states which AHN version it used, in which year that was surveyed, and how good the fit was (RMSE in centimetres). For almost the whole of the Netherlands that is the best you can get without surveying it yourself.
When 3DBAG is older than a newer AHN flight (for example a building with b3_pw_datum = 2020 while AHN6 flew over your map sheet in 2025), our cascade ticks through to layer 2: the raw AHN raster via the WCS services of PDOK (AHN4) or Ellipsis Drive (AHN5/AHN6). There we read out the height pixels within your BAG footprint and use the 95th percentile as the roof height. That is a method TU Delft and 3DGI also use in their roof-fit pipeline, and it aligns with data the Council of State has accepted as supporting evidence in several proceedings.
Only when neither 3DBAG nor a current AHN raster is usable does the cascade fall back on the BAG formula. That is deliberately the weakest step, because it is an estimate and not a measurement. Schaduwplan then shows, in the UI and in the PDF report, that this is an estimate, with an uncertainty of ±30%.
What is IHN?
In the background, the AHN programme is working on a successor in the area of data delivery. Not so much a new version of the survey, but a layer on top that brings all existing height sources (LiDAR from aircraft, dense matching from aerial photos, mobile laser scanners on cars and ships, drone LiDAR) together under a single service: the Integrale Hoogtevoorziening Nederland (IHN).
Status as of April 2026: it is not yet an operational service. Het Waterschapshuis, Rijkswaterstaat, TU Delft and the Kadaster are exploring the options together. The IHN study was completed in 2025 with a report that, among other things, sets out the need for sustained central funding and the need for standardised classification across different height sources. Decisions on funding and governance rest with the Ministry of Housing and Spatial Planning.
For Schaduwplan that is welcome news in the medium term. Once IHN is in place, we will no longer need to build our own cascade for urban edge cases (greenhouse complexes, recent new-build, T-shaped roofs). Until then we keep leaning on AHN as the foundation, with 3DBAG as the layer on top and with the option for users to upload their own surveys where the public data falls short.
Sources (13)
We back every article with public sources. Click to see all the original documents, rulings and datasets.
Sources (13)
We back every article with public sources. Click to see all the original documents, rulings and datasets.
AHN programme
- First part of AHN6 available (13 October 2025)— Het Waterschapshuis
- AHN Dataroom — web services, GeoPackages, tile index— Het Waterschapshuis
- AHN quality specification — vertical accuracy and point density— Het Waterschapshuis
- About the AHN programme— Het Waterschapshuis
- Where we are flying now — active flight lines 2026— Het Waterschapshuis
- Integrale Hoogtevoorziening Nederland (IHN)— Het Waterschapshuis
Viewers and downloads
- AHN Viewer — raster viewer per version and DTM/DSM— Het Waterschapshuis
- AHN point-cloud viewer (Potree)— Het Waterschapshuis
- HWH self-service download portal— Het Waterschapshuis
- GeoTiles — free tile packages of AHN data— TU Delft 3D Geoinformation
Data sources Schaduwplan combines with AHN
- 3DBAG — automatically reconstructed 3D models— TU Delft 3D Geoinformation and 3DGI
- BAG — Key Register of Addresses and Buildings— Kadaster
- PDOK Locatieserver— PDOK
Frequently asked questions
- How old is the height measurement of my roof on average?
- Between 0 and 10 years, depending on where you live. Since late 2025 the north-east sits in AHN6 (a 2025 survey). Many other regions still lean on AHN4 (2020–2022) or AHN5 (survey in progress). Since AHN3 the cycle is no longer a fixed 6 years; AHN5 and AHN6 run partly in parallel to improve currency.
- What is the difference between AHN, BAG and 3DBAG?
- AHN is the height measurement (laser from the air). BAG is the Kadaster’s Key Register of Addresses and Buildings (footprints and year of construction). 3DBAG combines the two: TU Delft fits a 3D roof shape onto the AHN point cloud, per BAG building. Schaduwplan uses 3DBAG as its primary source and falls back on the raw AHN rasters when 3DBAG is older than a newer AHN flight.
- May I use AHN data myself?
- Yes, every version is open data under Creative Commons Attribution 4.0. Only attribution of the source is required. Schaduwplan credits AHN and 3DBAG in every generated PDF, in line with the licence terms.
- What if my roof addition is newer than the AHN survey?
- Then it is not in the elevation model. Schaduwplan shows this in the UI and in the PDF report (“BAG estimate, ±30%”). For an exact shadow calculation on recent alterations you can survey it yourself (drone, handheld LiDAR, land surveyor) or add a permit document as a source. The GeoTIFF upload in Schaduwplan accepts your own DSM files and overrides the cascade for your building.
- What is a DSM and what is a DTM?
- DSM = Digital Surface Model: a surface model with roofs, trees, civil structures and buildings on top. DTM = Digital Terrain Model: the bare ground only. For sunlight analysis the DSM is the relevant one, because it is precisely roofs and obstacles that cast shadow. Schaduwplan mainly uses the DSM, via 3DBAG.
- Is AHN accurate enough for a sunlight study accepted by the court?
- Yes, for the vast majority of the Netherlands. AHN3 through AHN6 have a vertical accuracy of 5 cm systematic and 5 cm stochastic (1σ). That is comfortably within the margin TNO and municipalities apply in their sunlight policy, and it is the same data the Administrative Jurisdiction Division of the Council of State accepts in appeal proceedings.
- Who pays for the AHN programme?
- The water authorities, the provinces and Rijkswaterstaat together. For you as a user it is free. The reason is practical: these three parties are jointly responsible for managing the water system and flood defences, and they need an accurate elevation picture. The data is then released under CC-BY 4.0 to encourage reuse.
- What is IHN?
- The Integrale Hoogtevoorziening Nederland (Integrated Elevation Service for the Netherlands) is a study into a successor delivery layer that brings AHN, dense matching and mobile scans together under a single service. Status as of April 2026: it is not yet an operational service. The study was completed in 2025; decisions on funding and governance rest with the Ministry of Housing and Spatial Planning.
Which AHN version sits under your roof?
Enter your address and see in the source-data panel exactly which AHN flight 3DBAG used for your building, in which year that survey was flown and how good the roof-fit is. No account, no obligatory purchase.
Read more
Data sources
Drone, LiDAR or photogrammetry: capturing your own height data
When 3DBAG and AHN have not surveyed your home yet, you can commission height data yourself. Three routes are open: hire a surveying firm (€500–€5,000, 1–2 weeks), fly a drone yourself and process it in WebODM or RealityCapture (from €750 in hardware, one weekend), or use a phone photogrammetry app for visualisation. Thresholds, rules (Open A1/A2/A3, Remote ID 2026) and the GeoTIFF format Schaduwplan accepts.
Standards & municipalities
Less daylight because of your neighbours? What the court weighs
Losing daylight to a neighbour's extension or roof addition? Article 5:37 of the Dutch Civil Code protects light, not just direct sun. Courts have had the daylight factor calculated per room and ordered construction halted in 2024 and 2025. Daylight is the second leg alongside sunlight access; together they carry the most weight.
Standards & municipalities
Sunlight, daylight and neighbour law: which rules apply?
Three separate frameworks govern sunlight at a home. Sunlight access (the TNO standard) is a guideline, not a law. Daylight (Articles 4.146 and 4.147 of the Building Works Environment Decree) is the only one written into national law. Neighbour law (Article 5:37 of the Civil Code) governs unlawful nuisance. Window size counts for daylight, not for sunlight access.